

-
Conduct focus group discussions and interviews with stakeholders throughout the province to better understand climate-change and air pollution-related awareness, concerns, and needs among our populations of interest
-
Investigate temporal, multilevel, and spatial quantitative associations between exposure/sensitivity/adaptive capacity variables and various health indicators (cardiac, cerebrovascular, respiratory, renal, perinatal, mental health, dementia)
-
Compile information on perceived climate change vulnerability through group discussions, interviews, and surveys conducted with members of our communities of interest
-
Develop vulnerability and risk indices using the results and weighting generated in objectives 1, 2, and 3
-
Create, validate, and pilot test an online surveillance mapping tool and dashboard to provide a geographic representation of the vulnerability and risk indices
-
Host an interactive workshop with stakeholders and knowledge users to test the online surveillance tool and dashboard to solicit feedback and disseminate findings
Project Objectives
Guiding Frameworks
Our work is guided by frameworks proposed by the Intergovernmental Panel on Climate Change. To our knowledge, ACCLIMATES is among the first to employ both vulnerability and risk based approaches in the development of our climate-health surveillance tools.
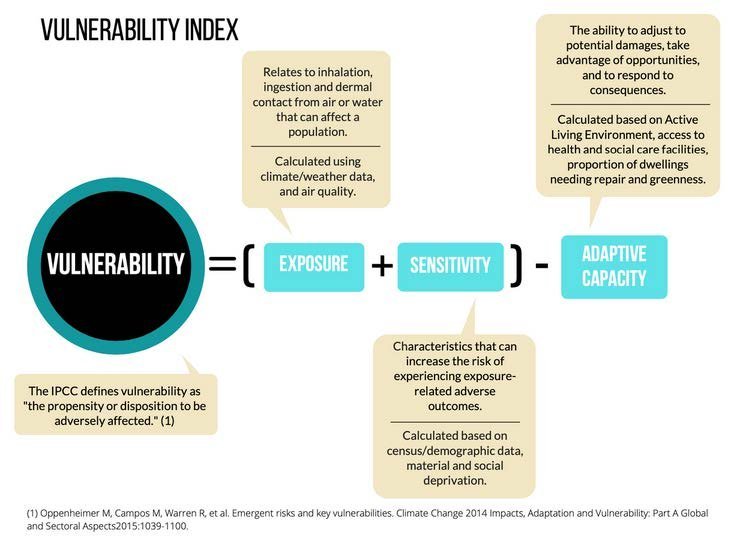
Vulnerability Index - This framework utilizes several data sources (e.g., environmental, census, and health datasets) to generate a comprehensive picture of climate change-related chronic disease vulnerability within whole populations. Vulnerability indices are constructed using the domains of exposure, sensitivity, and adaptive capacity.
Exposure refers to contact with different factors (e.g., heat waves, high solar UV radiation, extreme weather events) that can affect populations.
Sensitivity refers to characteristics that can increase individual's’ risk of experiencing adverse exposure-related health outcomes.
Adaptive capacity is the ability of individuals, communities, and institutions to adjust and mitigate adverse impacts of certain exposures and sensitivities (e.g., access to air conditioning or greenspace during a heatwave).

Risk Index - The risk-based index is a more recent framework released by the Intergovernmental Panel on Climate Change, which considers dimensions of hazards and exposure in addition to vulnerability.
Risk indices are also generated by considering important factors related to climate-health impacts, natural versus anthropogenic (i.e., human-driven) climate change, and various socioeconomic process and local, regional, national, and global levels.

Pilot-tested, validated, interactive, updatable, accessible, and population-specific vulnerability and risk-based online surveillance mapping tools and dashboards linking climate change, air pollution, and health
Workshops, newsletter, infographics, reports, and other materials aimed at stakeholders, members of our target populations, and the general public
Reports and evidence briefs intended for policymakers, decision makers, and health professional and organizations
Research manuscripts and academic conference presentations
What will come out of the ACCLIMATES project?

The surveillance tools developed by this project will support clinicians, public health officers, and health-services decision makers to better understand the health risks posed by climate change and air pollution.

They will help with the prioritization of risk and proactive adaption measures across the province and will assist with municipal planning and other environmental and emergency response actions and logistics.

Finally, our surveillance approach will align with other regional and provincial climate health surveillance initiatives taking place across the country, thus contributing to enhancing climate health surveillance capacity and resources Canada-wide.
*Please be aware that the surveillance tools, like the mapping, are estimates only and may not reflect differences within neighbourhoods. The maps are not intended to stigmatize neighbourhoods, only to provide an indication of the relative differences across the city.